
Figure 10.
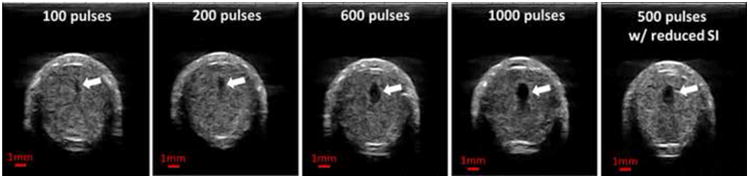
Representative ultrasound images of the cross sections of the flow channels generated using the single-focus strategy with different doses. The last image shows the flow channel generated with a reduced scan interval (0.15 mm). The generated flow channels show as the hypoechoic zones inside clots (block arrows). Therapeutic ultrasound propagated from the top to the bottom of the images.