
Figure 9.
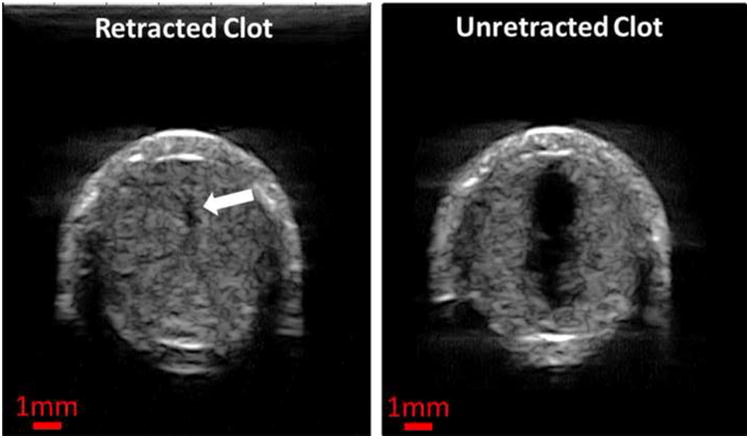
Representative ultrasound images of the cross sections of the flow channels generated using the single-focus strategy in one unretracted clot (left) and one retracted clot (right). The exact same treatment parameters (30 MPa P(-)LS , 0.3 mm Scan Interval and 100 pulses per treatment location) were used in both cases. The generated flow channels show as the hypoechoic zones inside clots (indicated by the block arrow in the left image). Therapeutic ultrasound propagated from the top to the bottom of the images.