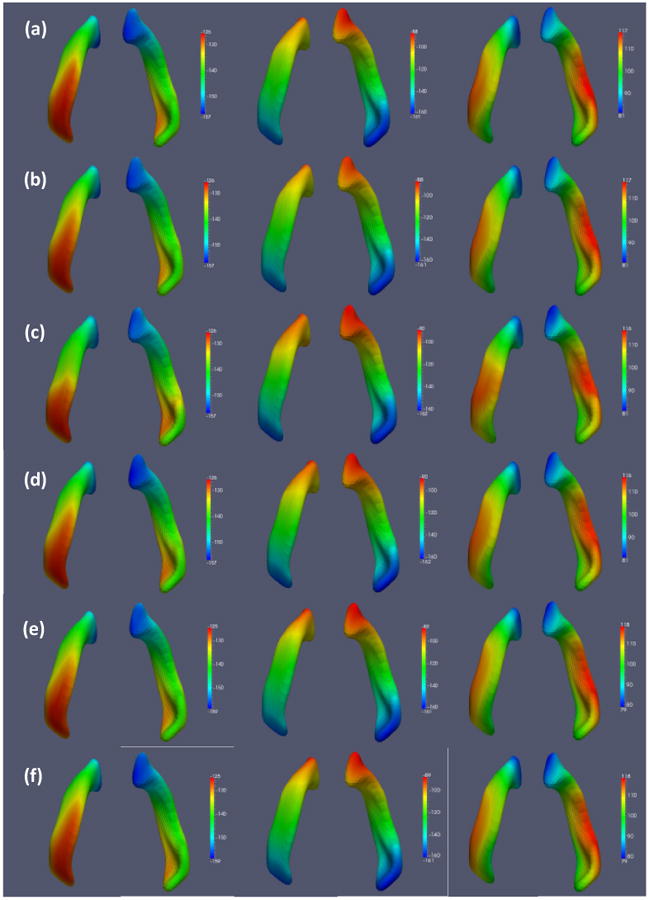
Figure 10.

Results from the surface data: (a) observed and (b) predicted coordinates for Subject 4; (c) observed and (d) predicted coordinates for Subject 5; (e) observed and (f) predicted coordinates for Subject 6. The x, y, and z coordinates are shown from left to right.
