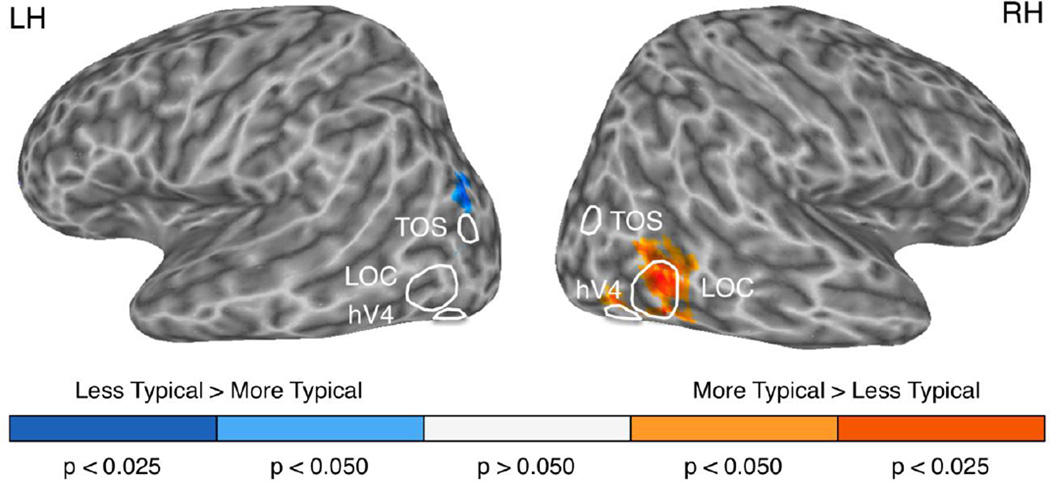
Fig. 4. Whole-brain searchlight analysis uncovers brain regions where category boundaries are stronger between most typical and least typical exemplars.
We performed a whole-brain searchlight analysis where we computed the difference between the category boundary effects obtained for the most typical half of our dataset and the least typical half of our dataset. Figure shows group map results, corrected for multiple comparisons using an FDR measure (see Materials and Methods for details). Regions shown in orange (right LOC, right hV4) showed a significant effect of typicality: highly typical exemplars were more distinguishable from exemplars of other categories. Conversely, regions shown in blue (left cIPL) showed the opposite trend: less typical exemplars were more easily distinguishable form members of other categories. This cortical region has been previously implicated in category learning (Zeithamova et al. 2008) and contextual processing (Konen and Kastner 2008), which suggests the possibility that it may aid in the categorization of atypical items, perhaps through mediating contextual facilitation of recognition.

