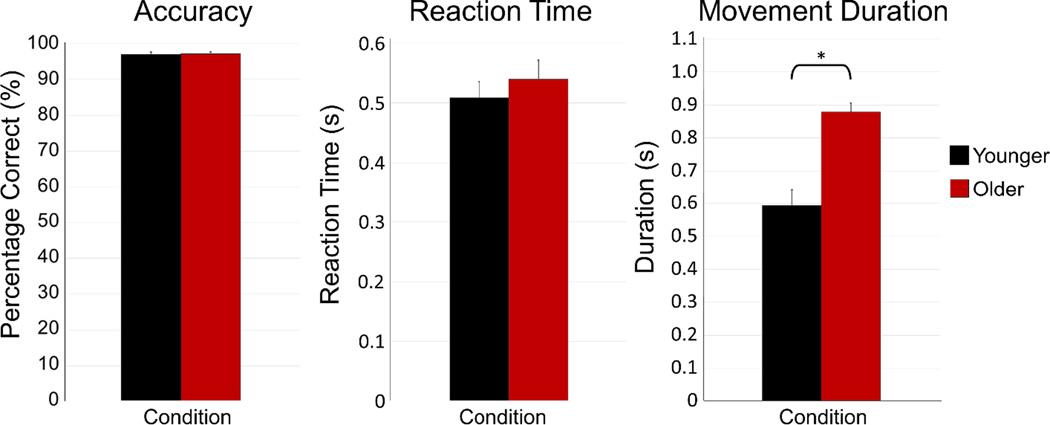
Figure 2. Motor task behavioral results.
There were no group differences in accuracy (percent correct) or reaction time (in s) between age groups (both p’s > 0.48). However, there was a significant difference in movement duration (in s), with older participants taking significantly longer to complete sequences than younger participants (p < .001). See legend for color descriptions. Error bars denote the standard error of the mean (SEM). * = p < 0.05

