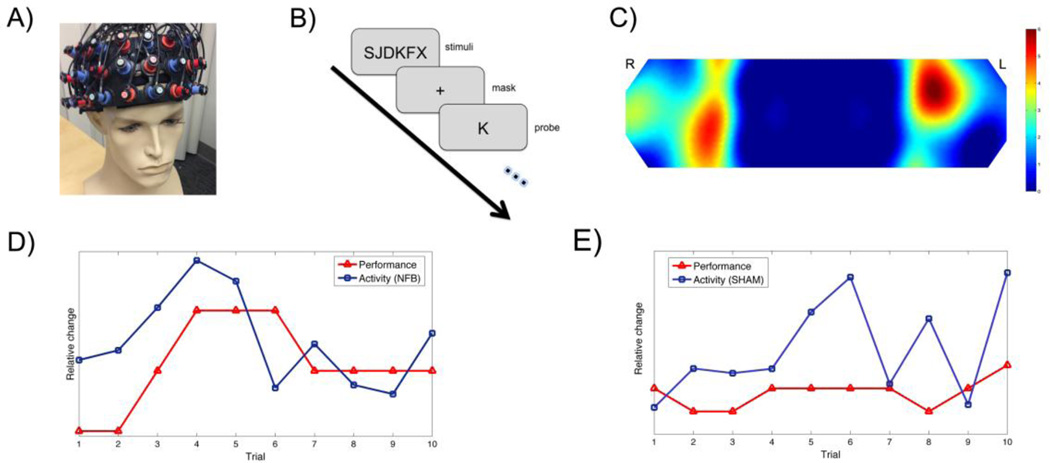
Figure 1. Neurofeedback setting.
A) The 52-channel NIRS probe set covering the prefrontal regions. B) The training task paradigm. C) Distribution of targeted regions across subjects. The colorbar indicates the overlap among subjects (hot color indicates more overlap across subjects). The unit is the number of subjects. The distribution of the selected target regions is consistent with previous data showing activity in the bilateral prefrontal cortex during Sternberg task performance. The line plot presentation of feedback of brain activity and task performance in the last ten trials for (D) NFB and (E) sham feedback for the SHAM groups. The horizontal axis represents the last ten trials of training while the vertical axis indicates the relative changes in performance and brain activity compared to baseline (arbitrary unit). The blue line (circle markers) shows changes in activity and the red line (rectangle markers) shows changes in performance compared to baseline.

