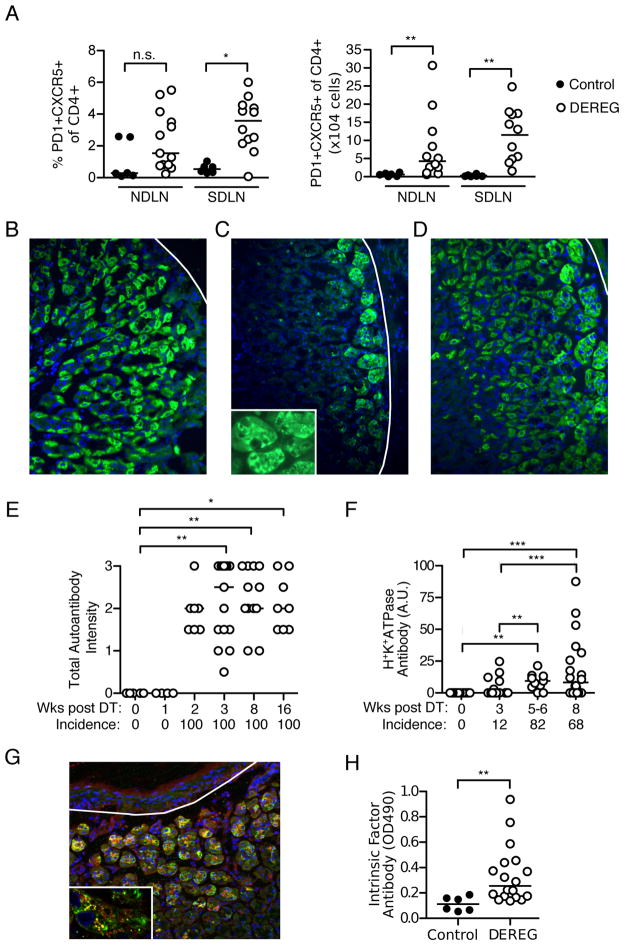
Figure 2. Tfh cell and autoantibody responses in Treg cell-depleted DEREG mice with AIG.
(A) Percentages (left) and absolute numbers (right) of PD1+CXCR5+CD4+ T cells in the NDLN and SDLN at 3 weeks in control and Treg cell-depleted DEREG mice. (B–D) Immunofluorescence patterns of serum gastric autoantibodies from Treg cell-depleted mice: (B) parietal cells only, (C) basal gland epithelial cells only, or (D) both cell types (green, IgG; blue, DAPI; x200; white lines denote base of gastric mucosa). Inset in C shows patchy cytoplasmic distribution. (E) Kinetics of total serum gastric IgG autoantibody incidences and staining intensities after Treg cell depletion detected by immunofluorescence. (F) Kinetics of gastric H+K+ATPase autoantibody incidence and titer after Treg cell depletion (ELISA). (G) Co-localization (yellow) of DEREG mouse serum autoantibody to basal gland epithelial cells (green) with anti-human IF antibody (red), detected by immunofluorescence on normal stomach sections (blue, DAPI; x200; white line denote base of gastric mucosa). Punctate pattern of co-localization is shown as yellow dots in inset (x800). (H) ELISA detection of IF autoantibody in control and Treg cell-depleted mice at 3 weeks. The latter mice were selected based on the presence of autoantibodies directed to basal gland epithelial cells (present in 69% of mice). Data were pooled from 2–11 independent experiments per time point. Each symbol represents an individual mouse. *p<0.05, **p<0.01, ***p<0.001; Kruskal-Wallis tests with Dunns posttests (E, F); Mann-Whitney t test (A, H).

