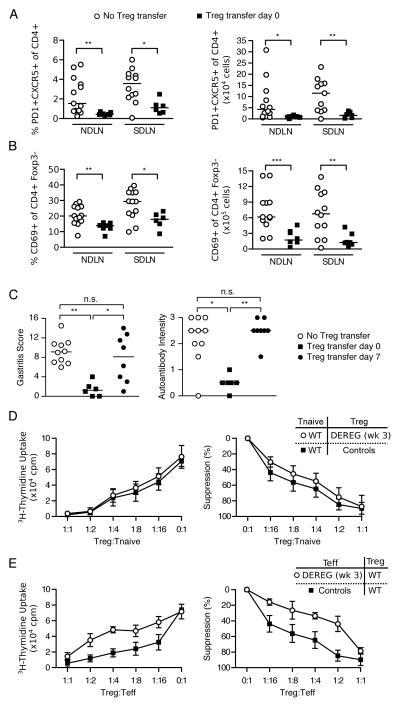
Figure 3. Effector T cells from DEREG mice with transient Treg cell depletion are less sensitive to suppression by Treg cells in vitro and in vivo.
Percentages (left) and absolute numbers (right) of (A) PD1+CXCR5+ of CD4+ T follicular helper cells or (B) CD69+ of CD4+Foxp3− activated T cells in the NDLN or SDLN at 3 weeks in Treg cell-depleted DEREG mice with (filled squares) or without (empty circles) WT Treg cell reconstitution at day 0 of DT treatment. (C) Gastritis score (left) and gastric IgG autoantibody intensity (right) at 3 weeks in Treg cell-depleted DEREG mice with or without infusion of WT Treg cells at day 0 or day 7 after the first dose of DT treatment. (D) Suppression of naïve CD4+CD25− T cell proliferation by CD4+CD25+ Treg cells from WT mice or from the SDLN of DEREG mice obtained at 3 weeks after DT treatment. (E) Suppression of proliferation of CD4+CD25− T cells from WT mice or from the SDLN of DEREG mice obtained at 3 weeks after DT treatment by CD4+CD25+ Treg cells from WT mice. Proliferation of CD4+CD25− T cells in D and E was assessed by uptake of [3H]thymidine (representative mean and standard deviations of cpm from 5 wells each in 1 experiment, left; average percent suppression of 2–3 experiments, right). p = 0.0950 in D, p = 0.0280 in E (three-way ANOVA with F-test). Data in A–C were pooled from 3 independent experiments and each symbol represents an individual mouse. *p<0.05, **p<0.01, ***p<0.001; Kruskal-Wallis test with Dunns posttests (C) or Mann-Whitney t tests (A, B).

