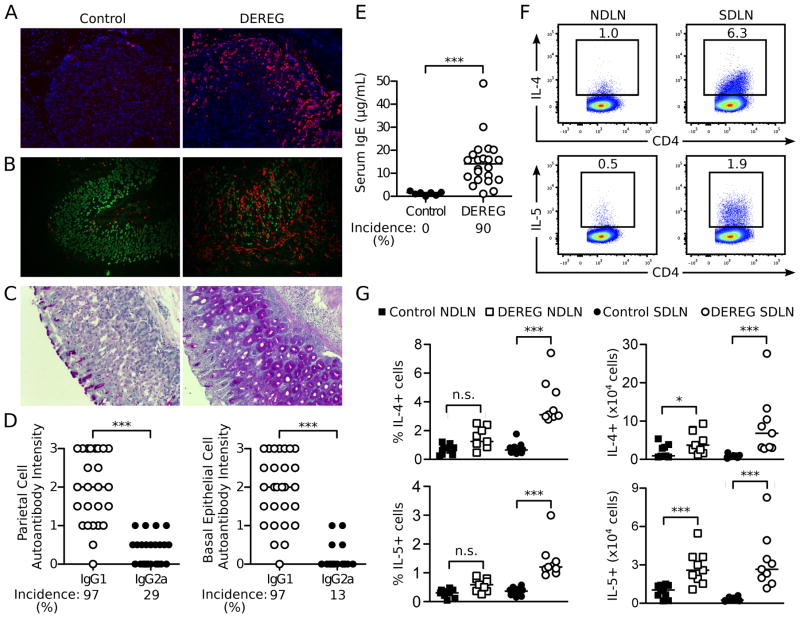
Figure 4. AIG in Treg cell-depleted DEREG mice is predominantly associated with Th2 cell responses.
(A) Representative immunofluorescence microscopy images of eosinophils in the stomach mucosa from control (left) and Treg cell-depleted mice (right) at 1 week (red, SiglecF; blue, DAPI; x200). (B) Co-localization of parietal cells and eosinophils in representative immunofluorescence microscopy images of stomach mucosa from control (left) and Treg cell-depleted DEREG mice with AIG (right) (red, SiglecF; green, mouse serum antibody to gastric parietal cells; x200). (C) Mucin-positive cells in stomach sections from control (left) and Treg cell-depleted mice (right) at 3 weeks (Periodic acid-Schiff stain; x100). (D) Intensity and prevalence of serum IgG1 and IgG2a autoantibodies to parietal cells (left) and basal epithelial cells (right) from DEREG mice detected by indirect immunofluorescence. (E) Total serum IgE levels and prevalence in control and Treg cell-depleted DEREG mice. (F) Representative flow cytometry dot plots of IL-4 and IL-5 producing CD4+ T cells in the SDLN and NDLN of Treg cell-depleted DEREG mice at 3 weeks (cells were stimulated ex vivo by PMA and ionomycin before flow cytometry analysis). (G) Quantitation of F (left: percentage; right: absolute number). Data were pooled from 3 (F, G), 4 (E), and 6 (D) independent experiments. Each symbol represents an individual mouse. *p<0.05, **p<0.01, ***p<0.001; Kruskal-Wallis tests with Dunns posttest (G left); Mann-Whitney t tests (D, E, G right).

