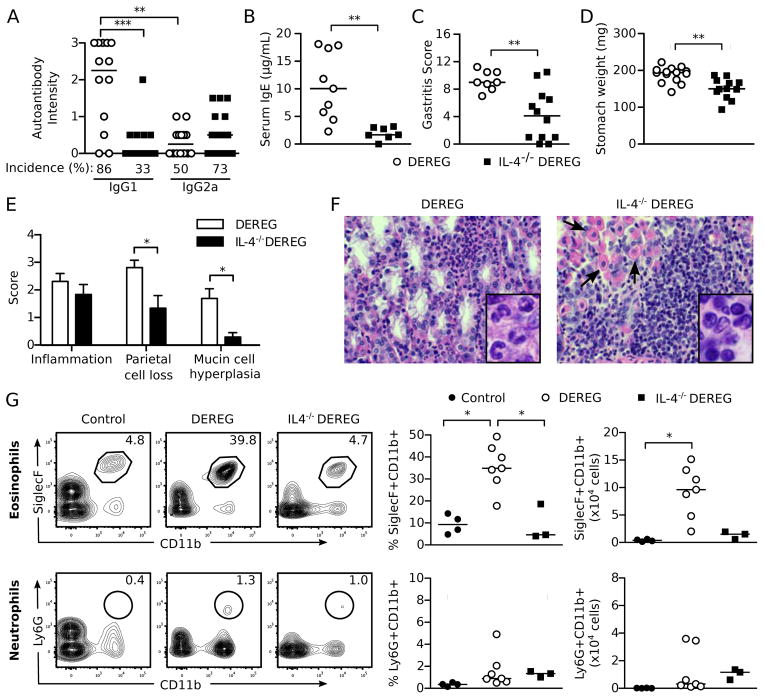
Figure 5. IL-4 contributes to AIG pathogenesis in Treg cell-depleted DEREG mice.
(A) Serum IgG1 and IgG2a gastric autoantibody staining intensities by immunofluorescence, (B) serum IgE levels, (C) total gastritis score, (D) stomach weights, (E) score of individual histopathologic findings of AIG in the stomach, and (F) stomach infiltrating cells (H&E x400; arrows indicate residual parietal cells) of IL-4-sufficient DEREG and IL-4−/− DEREG mice at 3 weeks. Insets (enlarged from x1000): note the numerous granulocytes in stomachs of IL-4−/− DEREG mice (left) and the numerous mononuclear cells in the IL-4-sufficient DEREG mice (right). (G) Flow cytometric analysis of SiglecF+CD11b+ eosinophils (top) and Ly6G+CD11b+ neutrophils (bottom) isolated from stomachs of control mice and Treg cell-depleted WT and IL-4−/− DEREG mice at 3 weeks. Representative plots (left) were gated on live CD45+ cells (numbers indicate percentages of cells in the gates). Percent (center) and absolute numbers (right) of eosinophils and neutrophils are quantified. Data were pooled from 3 (G), 4 (B–E), and 7 (A) independent experiments. Each symbol represents an individual mouse (A–E) or a pool from 3 mice (G). *p<0.05, **p<0.01, ***p<0.001; Kruskal-Wallis tests with Dunns posttests (A, G); Mann-Whitney t tests (B–E).

