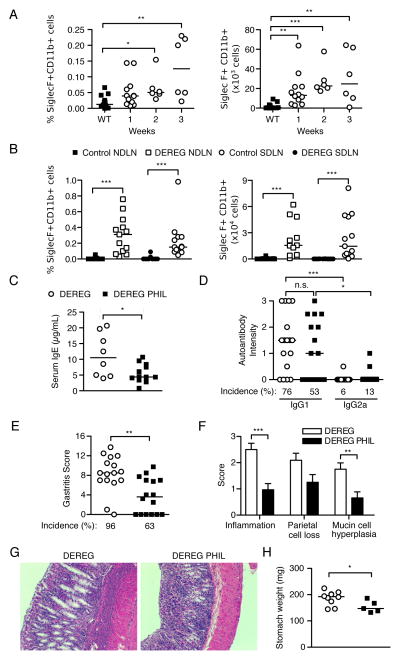
Figure 6. Eosinophils contribute to AIG pathogenesis in Treg cell-depleted DEREG mice.
(A) Kinetics of SiglecF+CD11b+ eosinophil expansion in pooled lymph nodes as percentage (left) and absolute number (right). (B) Percentage (left) and absolute number (right) of eosinophils in the NDLN and SDLN of control and Treg cell-depleted DEREG mice at 3 weeks. (C) Serum IgE levels, (D) serum IgG1 and IgG2a gastric autoantibody staining intensities, (E) Gastritis severity and prevalence, (F) score of individual histopathologic findings of AIG in stomach, (G) representative stomach histopathology (H&E, x100), and (H) stomach weights in DEREG mice (open symbols) and eosinophil-deficient DEREG PHIL mice (filled symbols) at 3 weeks. Data were pooled from 5 (A) or 7 (B–H) independent experiments. Each symbol represents an individual mouse. *p<0.05, **p<0.01, ***p<0.001; Mann-Whitney t tests (B right, C, E, F, H); Kruskal-Wallis tests with Dunns posttest (A, B left, D).

