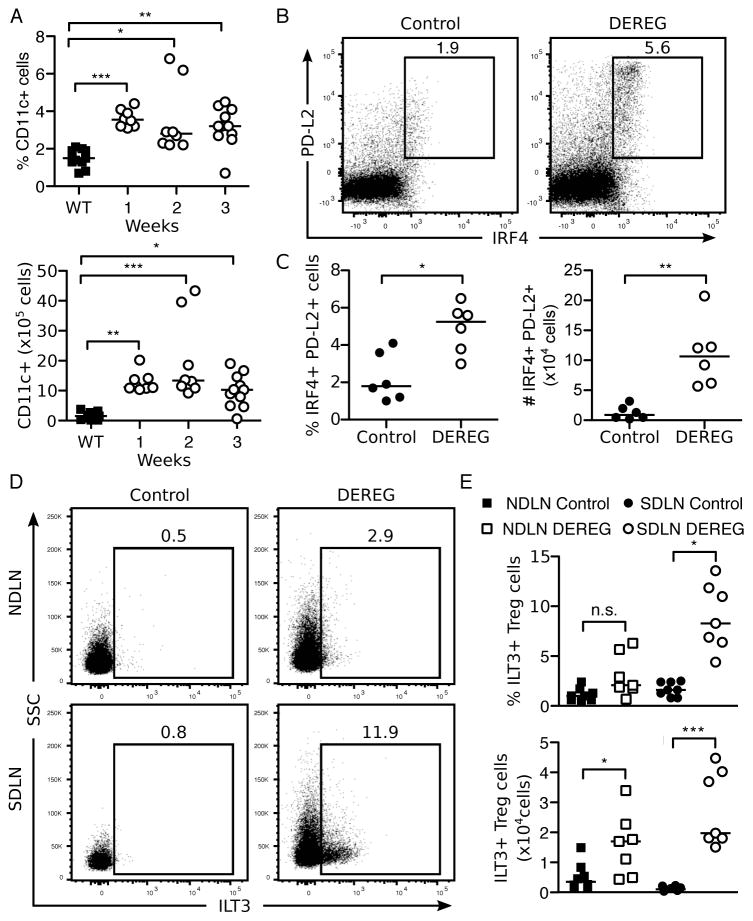
Figure 7. Increase in Th2-promoting PD-L2+IRF4+ dendritic cell subsets as well as ILT3+ Treg cell subsets in transiently Treg-cell depleted DEREG mice.
(A) Kinetics of the percentage (top) and absolute number (bottom) of live, CD11c+ dendritic cells in pooled lymph nodes. (B) Representative flow cytometry dot plots (top, numbers indicate percentages of cells in the gates) and quantitation as percentage (bottom, left) and absolute number (bottom, right) of IRF4+PD-L2+ dendritic cells among live, CD4−, CD11c+, MHCII+ cells in pooled SDLN and NDLN of control and Treg cell-depleted DEREG mice at 1 week. (C) Representative flow cytometry dot plots (left, numbers indicate percentages of cells in the gates) and quantitation as percentage (top, right) and absolute number (bottom, right) of ILT3+ Treg cells among live, CD4+, Foxp3+ cells in the SDLN or NDLN of control and Treg cell-depleted DEREG mice at 3 weeks. Data were pooled from 2 (B), 3 (C), or 5 (A) independent experiments. Each symbol represents an individual mouse. *p<0.05, **p<0.01, ***p<0.001; Mann-Whitney t tests (B, C bottom); Kruskal-Wallis tests with Dunns posttest (A, B top).

