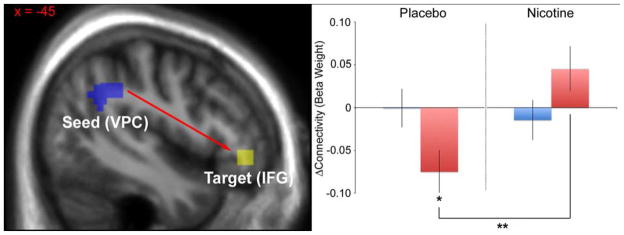
Figure 1.
Effect of nicotine on task-associated connectivity between the VPC and left IFG. Left: Diagram showing location of the seed ROI (left VPC) and the left target ROI (IFG). Right: Charts illustrating the direction and magnitude of the significant interaction effect. Beta weights represent relative connectivity between the left VPC seed and the left IFG ROI. *p < 0.05, controls vs. patients during placebo. **p < 0.05, placebo vs. nicotine in patients. Error bars represent the standard error.

