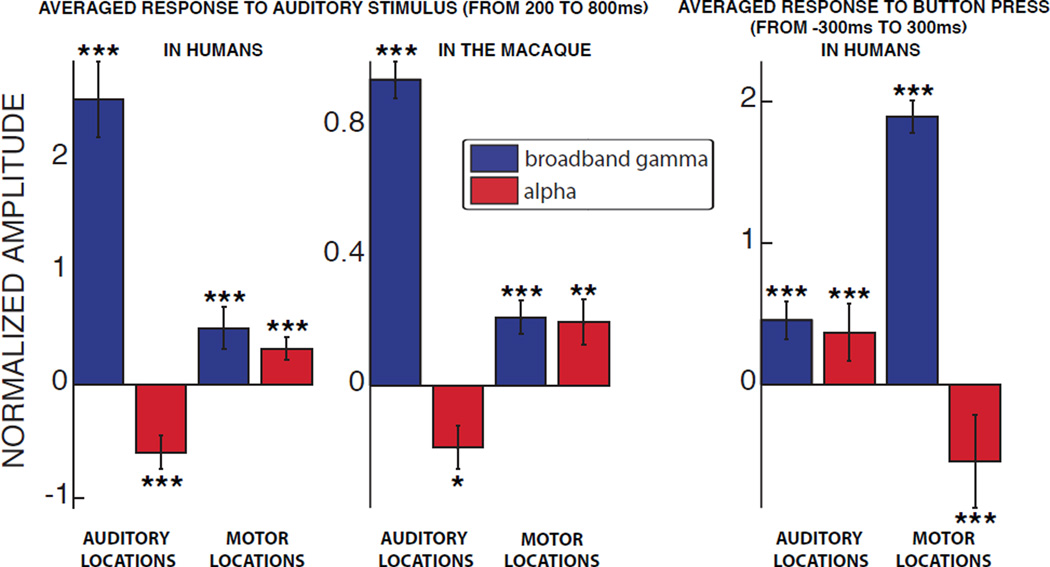
Figure 2. Alpha power is suppressed in task-related locations and increased in non-related locations.
The bar plots show the amplitude of the responses, averaged across all task-related locations (i.e., auditory or motor areas), during the auditory task in humans (left panel), macaque (middle panel), and motor task in humans (right panel) for broadband gamma (blue) and alpha (red) bands. Error bars denote the standard error. *: p < 0.05; **: p < 0.01; ***: p < 0.001.

