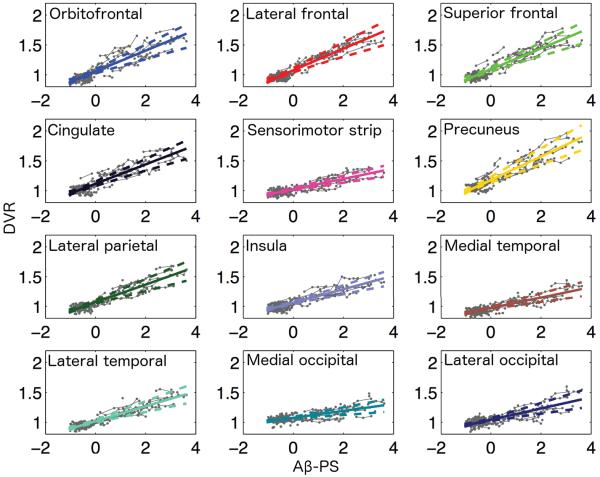
Figure 10.
Regional trajectories as function of Aβ-PS. The PS model was used to make voxelwise predictions at a range of Aβ-PS values, and these predictions were averaged within each ROI to obtain regional trajectories. The dashed lines indicate the 95% confidence bands for the cortical regions. Estimated trajectories with their 95% confidence bands are superimposed on observed longitudinal data (in gray).

