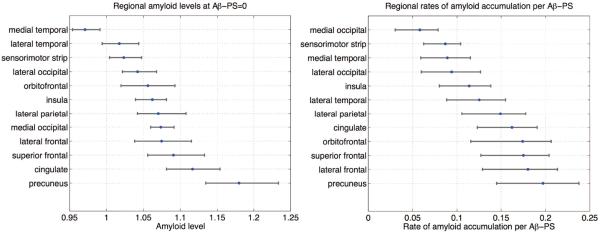
Figure 11.
Comparison of levels of amyloid at Aβ-PS= 0 and rates of amyloid accumulation across cortical regions. The intercept parameter b obtained from the PS model was averaged within each ROI to obtain the regional amyloid levels at Aβ-PS= 0, and the trajectory slope parameter a was averaged within each ROI to obtain regional rates.

