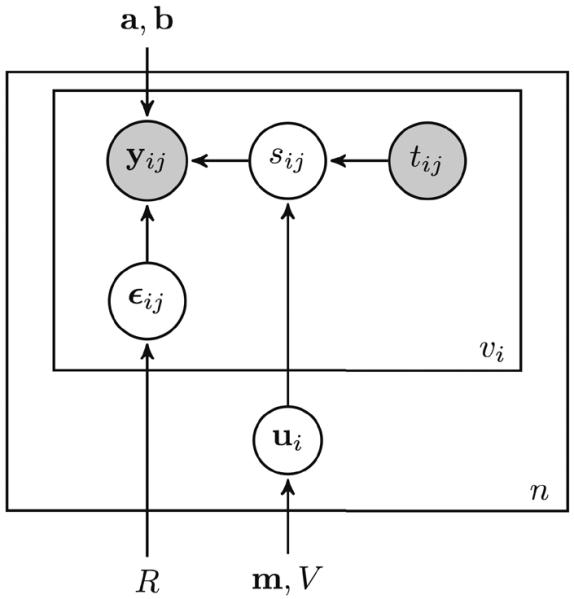
Figure 2.

Probabilistic model of the progression score using plate notation. The progression score sij establishes the link between age tij and the voxelwise observations yij. Circles indicate variables, and known measures are shaded. Rectangles indicate that the same model applies across visits (inner rectangle) and individuals (outer rectangle). Arrows indicate dependencies between variables and parameters.
