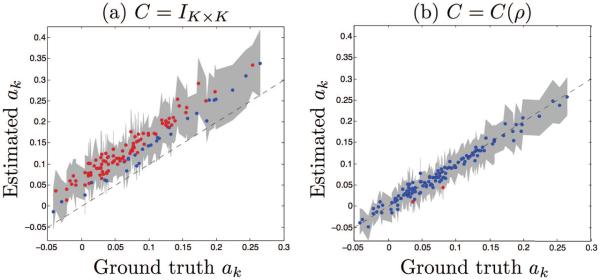
Figure 3.
Estimated trajectory slope parameters αk vs ground truth. Dashed line indicates x = y. Gray band corresponds to the 95% confidence intervals obtained from bootstrapping. Estimates are shown in blue if their 95% confidence interval intersects the x = y line, and in red otherwise. Results from the model where (a) C = IK×K and (b) C = C(ρ).

