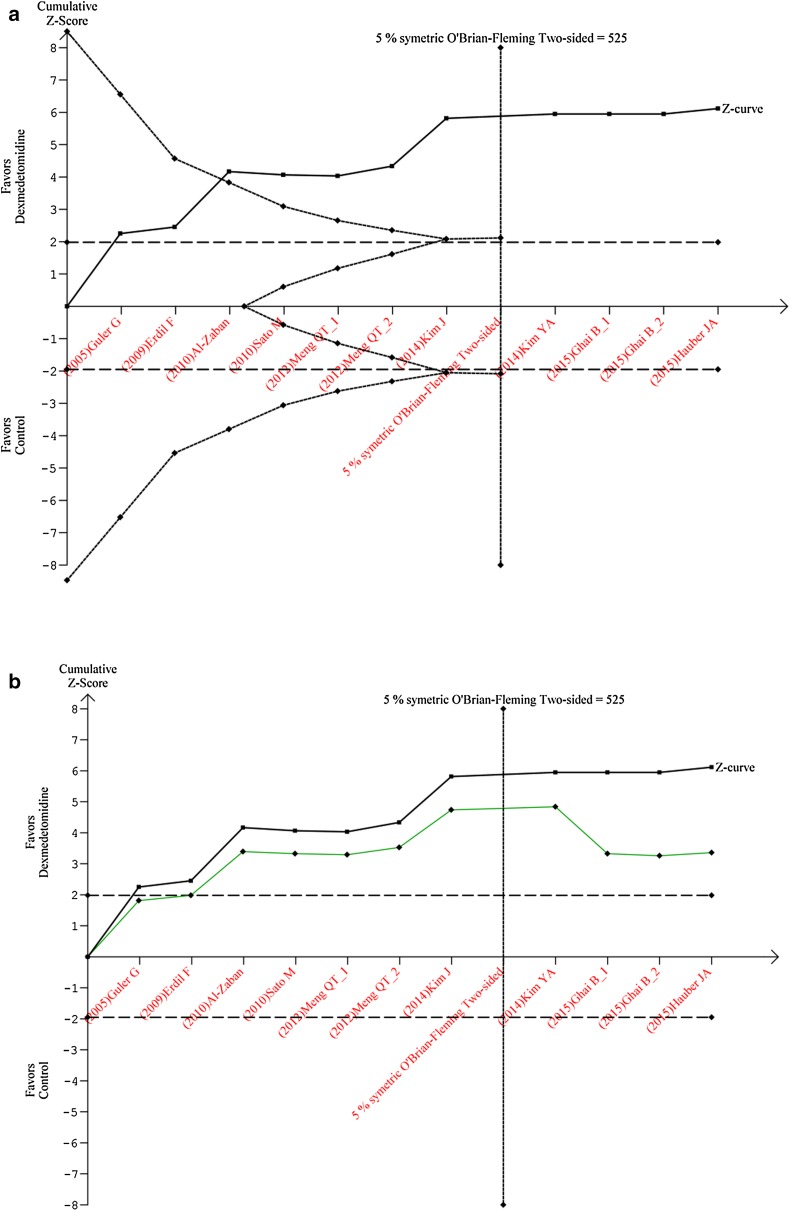
Fig. 5.
a Trial sequential analysis graph (x-axis studies effect, y-axis cumulative z scores). The displaying in the full line displays the cumulative z score, the horizontal dotted line the boundaries of significance (results in the region within these boundaries are non-significant), the vertical line the meta-analysis information size (size of patients to be included in order to show a significant outcome: 525). The etched lines the upper inward-sloping represents the trial sequential monitoring boundary and the lower outward-sloping the futility region. Given the evolution of the z score outside the futility region and crossing the monitoring boundary curve (constructed with low-risk bias studies), the opioid-sparing effect of dexmedetomidine is confirmed. b Correction for previous meta-analyses of trial sequential analysis graph: (x-axis studies effect, y-axis cumulative z scores). The upper curve represents the actual z scores analysis without correction and the lower one the corrected z scores taking in account previous analyses

