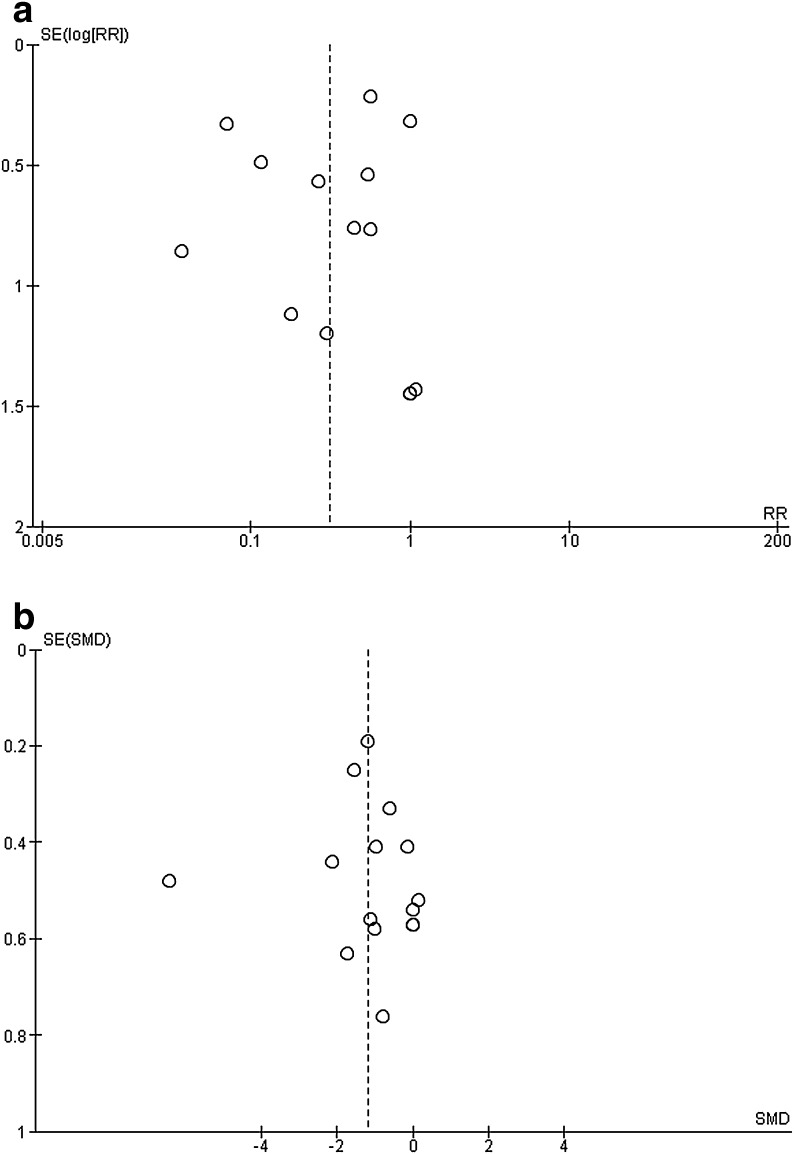
Fig. 6.
a Funnel plot of Dex effect upon opioid consumption in PACU. b Funnel plot of Dex effect upon postoperative pain intensity in PACU. Graphs display the intervention effect (RR or SMD) estimates from individual studies in the x-axis against some measure of each study’s size or precision (standard error of the intervention effect) in the y-axis. Dex dexmedetomidine, PACU postanesthesia care unit, RR risk ratio, SE standard error, SMD standardized mean difference

