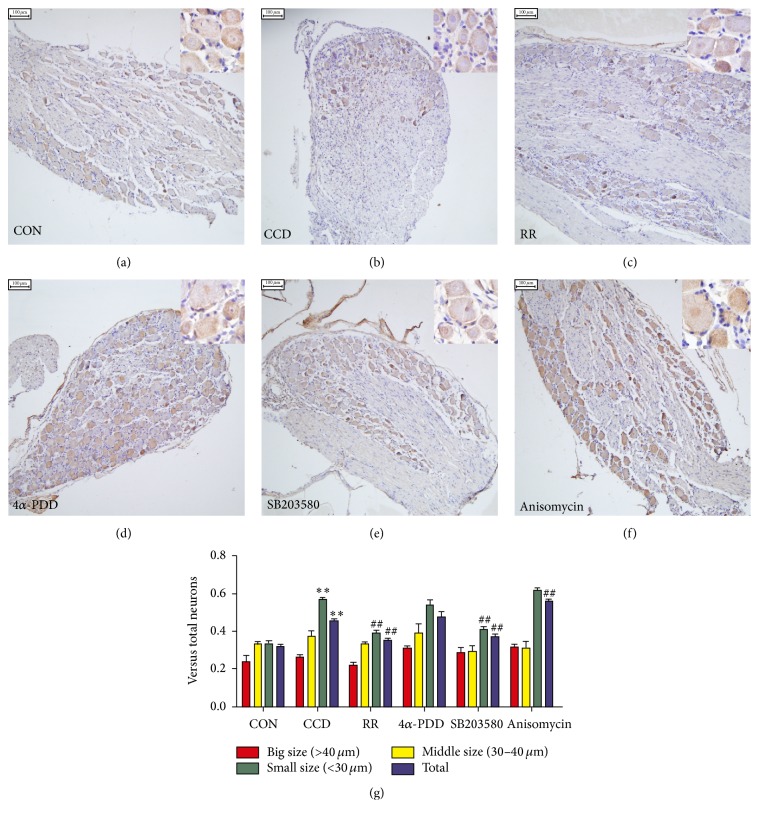
Figure 4.
Altered distribution of TRPV4-positive neurons in DRG tissue. (a–f) TRPV4 immunohistochemical staining of the DRG neurons in the control, CCD, CCD+RR 10 nmol/L, CCD+4α-PDD 10 nmol/L, CCD+SB203580 20 μmol/L, and CCD+anisomycin 25 μg/mL groups, respectively. Scale bars: 100 μm. (g) The analysis of the TRPV4-positive neurons (shown as means ± SEMs); ∗∗ P < 0.01 compared with controls; ## P < 0.01 compared with the CCD group.

