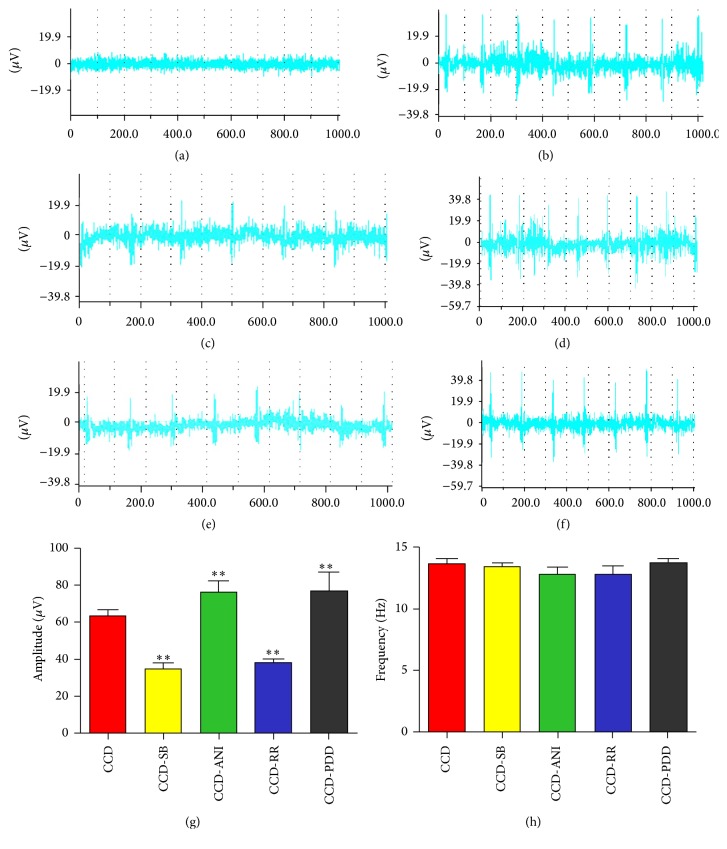
Figure 6.
Ectopic discharges after CCD surgery and reagent injection. (a–f) represent discharges of the control, CCD, CCD+RR 10 nmol/L, CCD+4α-PDD 10 nmol/L, CCD+SB203580 20 μmol/L, and CCD+anisomycin 25 μg/mL groups. Cut from BL-420E+ biological and functional experimental system. (g) and (h) show the amplitudes and frequencies for the different groups (data are expressed as means ± SEM); ∗∗ P < 0.01, compared with the CCD group (7-8 rats in each group).

