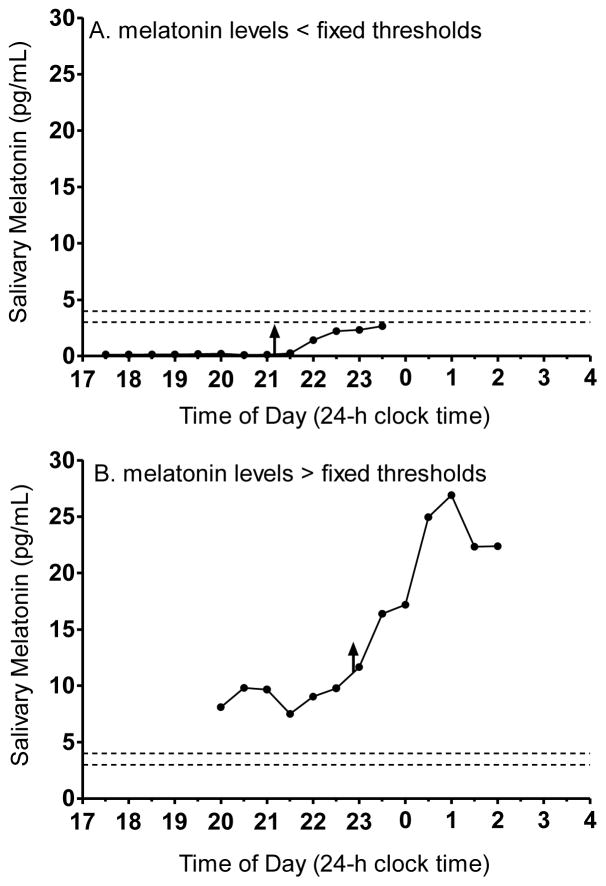
Figure 2.
Examples of 30-minute sampling melatonin profiles in which the DLMO was missed when using the fixed threshold methods, 3 pg/mL and 4 pg/mL. Each threshold is indicated by the dashed horizontal lines. A: DLMO was not computed because melatonin values were lower than both fixed thresholds. B: DLMO was not computed because melatonin values were higher than both fixed thresholds. The upward facing arrows indicate the DLMOs computed using the 2 SD threshold approach (21:09 for the profile in A and 22:48 for the profile in B).

