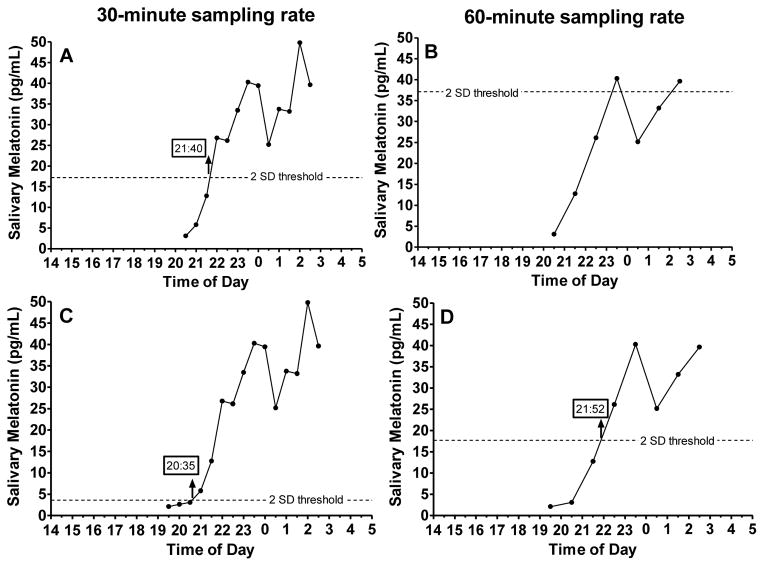
Figure 4.
Example of a 30-minute (A) and a 60-minute (B) 6-h sampling profile in which the 2SD thresholds were outliers. All profiles in this figure are from the same individual who participated in the summer study with a scheduled bedtime of 01:30. The 2 SD threshold was 17.2 pg/mL in the 30-minute sampling profile and 37.1 pg/mL in the 60-minute sampling profile. By adding to the 30-min (C) and 60-min (D) profiles samples acquired 1 h earlier, we illustrate that low daytime levels were missed by our 6-h sampling window and adding one hour to the sampling window can change the 2SD threshold and therefore the DLMO estimate. DLMOs computed from the available samples are indicated by upward-facing arrows with times provided in the box.

