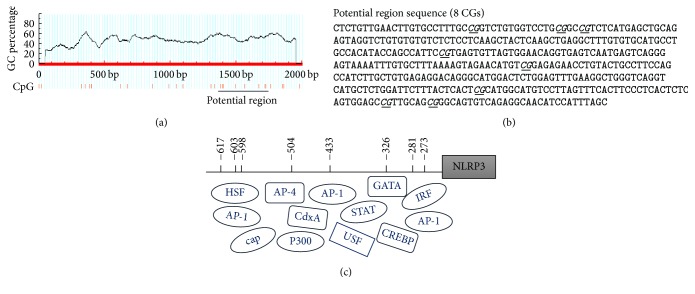
Figure 4.
Analysis of NLRP3 promoter region. (a) Computational prediction of CpG-rich sites in NLRP3 promoter. Criteria used for prediction were island size >200 bp, GC percentage >50%, and observed/expected CpG ratio >0.6. (b) Sequence of potential promoter region. CpG sites were underlined and italic. (c) Schematic overview of CpG sites located in NLRP3 promoter region. The boxes of transcript factors matched their binding sites in promoter region. The binding sites were predicted using TFSEARCH software.

