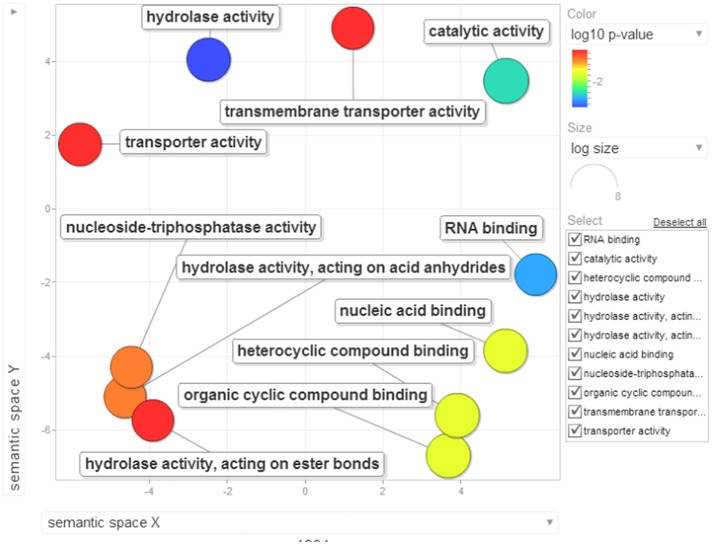
Figure 11.
Visualization of molecular function terms of differentially down-regulated proteins identified based on enrichment analysis. Bubble color denotes the p-value (legend provided in the image); bubble size indicates the frequency of the GO term in the underlying GOA database. List of GO terms representing the molecular functions along with p-values has been added as a Table S8C.

