Fig. 4.

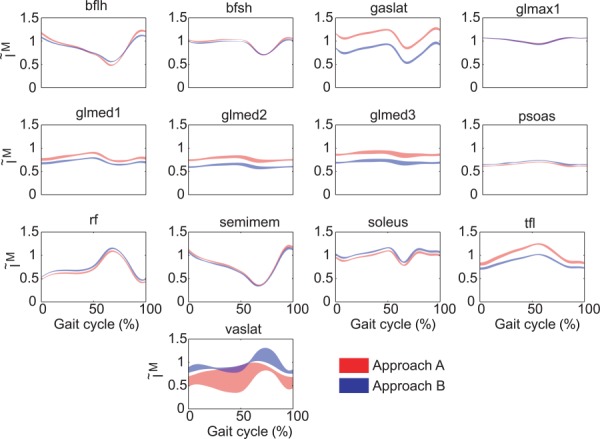
Normalized muscle fiber lengths for muscles with the greatest differences in mean muscle forces between approaches A and B. The plotted area corresponds to the mean ± 1 standard deviation for all six gait cycles.

Normalized muscle fiber lengths for muscles with the greatest differences in mean muscle forces between approaches A and B. The plotted area corresponds to the mean ± 1 standard deviation for all six gait cycles.