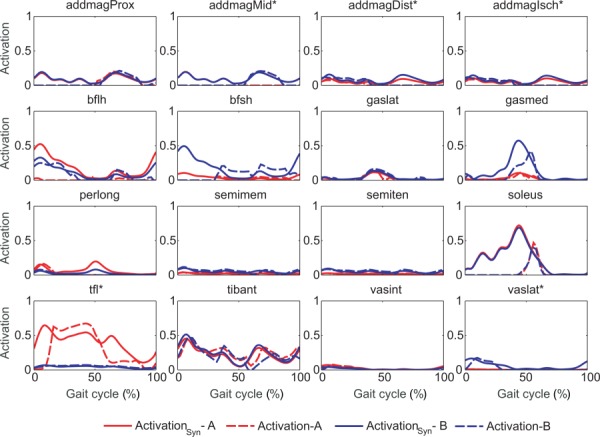
Fig. 5.

Activations reconstructed from synergy components (activationSyn in solid lines) and model activations (activation in dashed lines) for muscles with associated experimental EMG data in one representative gait cycle. Asterisks (*) indicate statistically different r values between approaches A and B.
