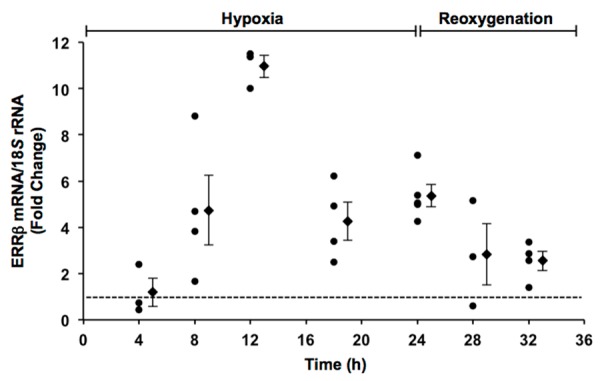
Figure 1.

Scatter plot showing the effects of hypoxia and reoxygenation on ERRβ mRNA levels in contracting cardiomyocytes as a function of time. Fold changes in ERRβ mRNA levels were calculated relative to contracting cardiomyocytes in normoxia as indicated by the dotted line. Also shown is the mean ± SE of individual experiments at each time point.
