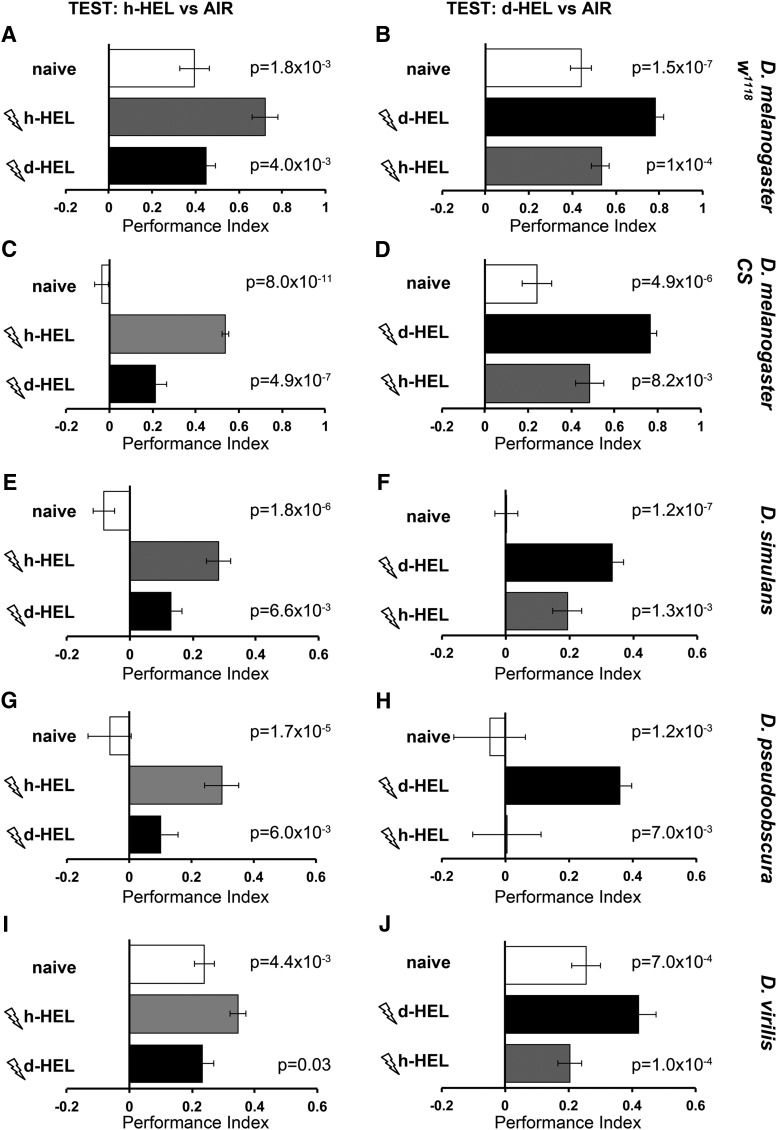
Figure 7.
Behavioral discrimination of 1-hexanol isotopologues within the genus Drosophila. The mean 1-hexanol isotopologue avoidance ± SEM of complementary experiments is shown. The Drosophila strains and species tested are indicated on the right of each pair of experiments. The graphs are shown horizontally to reflect the actual distribution of the flies in the left and the right arms of the T-maze. Room air is shown delivered on the right arm, whereas the odorant on the left, although in actuality the side of air and odorant delivery were alternated semi-randomly. Open bars indicate the naive response to the indicated isotopologue vs room air. A, C, E, G, I, Flies were exposed to 12–90 V electric footshocks (thunderbolts) in the presence of either normal (h-HEL, gray bars) or perdeuterated (d13-HEL, black bars) 1-hexanol and then tested for avoidance of the normal isotopologue vs air. The complementary experiments are shown in B, D, F, H, and J, with flies exposed to electric footshocks (thunderbolts) in the presence of either normal (h-HEL, gray bars) or perdeuterated (d-HEL, black bars) 1-hexanol and then tested for avoidance of the perdeuterated odorant vs air. Differences in the performance of each group were investigated by an initial ANOVA followed by least square means contrast analysis. The group trained to avoid the same isotopologue as used for testing was denoted as the control group, and the probabilities that it performed differently than naive or animals trained to the other isotopologue are shown above each relevant bar. n ≥ 8 for all groups.

