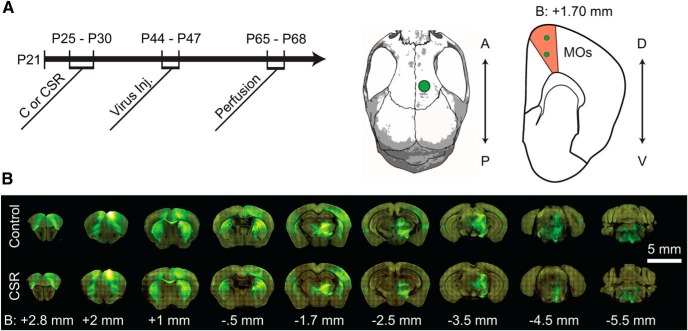
Figure 1.
Experimental Timeline and MOs Projections. A, Experimental timeline. Between P25 and P30, mice were allowed to sleep normally (C) or subjected to CSR. All mice were injected with AAV-GFP between P44 and P47, and each mouse was perfused exactly 3 weeks later. Middle, Right, The location of the viral injections on the skull and in a coronal brain section. A, Anterior; P, posterior; D, dorsal; V ventral; B, bregma. B, Example of projections from MOs in two representative mice (C and CSR) 3 weeks after injection of AAV-GFP. Measurements are given in millimeters from bregma. Final analysis included 14 mice in each group.

