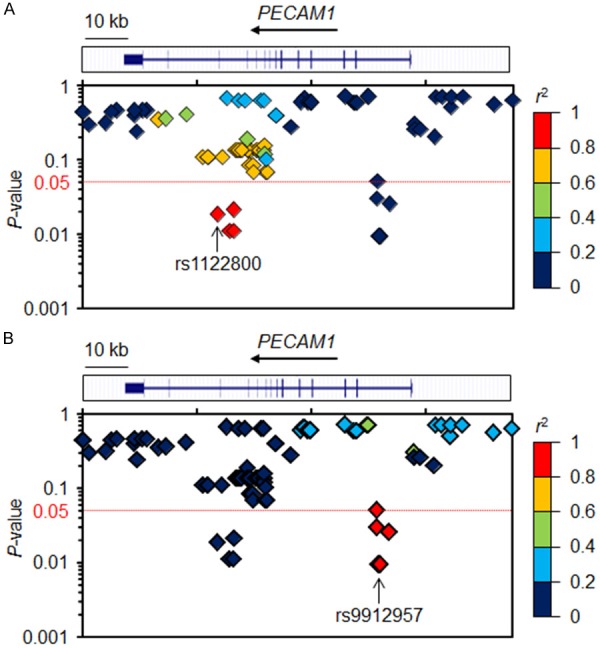
Figure 2.

Association plot of SNPs surrounding the PECAM1 gene. Association plot of 19 genotyped and 63 imputed SNPs. Each SNP is plotted along the chromosomal position. Pairwise r 2 between a particular SNP and (A) rs1122800 or (B) rs9912957 is colored on a scale from low (blue) to high (red).
