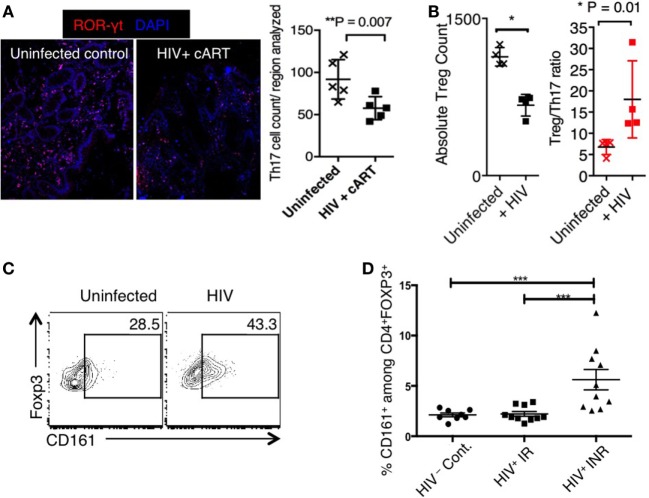
Figure 2.
(A) Loss of Th17 cells in biopsies of transverse colon in HIV patients on cART. Frozen blocks of the biopsies were fixed, immunofluorescent stained using α-RORγt antibody (red) and 6-diamidino-2-phenylindole (DAPI) (nucleus; blue), and assessed by confocal microscopy. Confocal micrographs (left) and statistics (right). HIV infection induces Treg cell loss (B), but CD161 up-regulation in Tregs (C) in HTC. Three days after in vitro HIV infection, we stimulated the tonsillar cells using α-CD3 (T-cell receptor activation) and α-CD28 antibodies, and assessed the cells by flow cytometry 3 days later. Representative flow cytometric analyses show Foxp3+ Treg cell count (left), and Treg/Th17 ratio (right) (gated on CD4+ cells) (B), and CD161 expression in Foxp3+ cells (C). (D) CD161 expression on FOXP3+ CD4 T cells in HIV-1 infected IR and INR patients. Shown are the frequencies of CD161+ cells gated on CD3+, CD4+, FOXP3+ CD127−CD25+ in 10 IR (Median age 47.8, 7M 3F, median CD4 count 910 c/ul), 10 INR (Median age 51.9, 7M 3F, median CD4 count 270 c/μl), and 8 HIV-uninfected healthy controls (HIV−Cont.). PBMCs were stained with the fluorochrome-conjugated antibodies, acquired by LSRII Fortessa and analyzed by flowjo. Anova test was used for multi-comparison analysis using graphPad Prism software. ***P < 0.0001.

