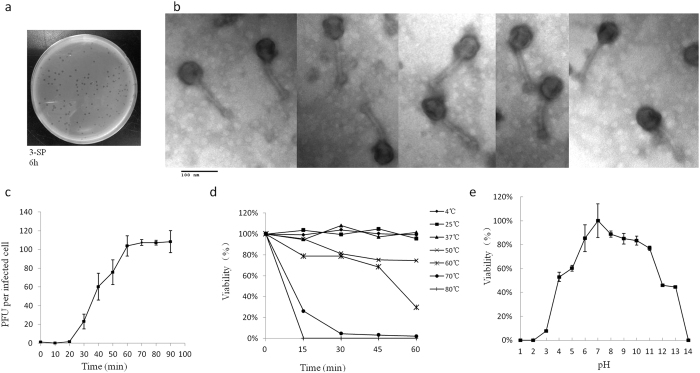
Figure 1. Isolated enterobacteria phage phiEap-2.
(a) Plaques of phage phiEap-2 on E. aerogenes 3-SP. (b) Transmission electron micrograph (TEM) of phage phiEap-2 at × 150 000. The bar indicates 100 nm. (c) One-step growth curve of phiEap-2. Phages were grown in an exponential phase culture of E. aerogenes. (d) Stability of phage phiEap-2 at different temperatures. (e) Stability of phage phiEap-2 at different pH.

