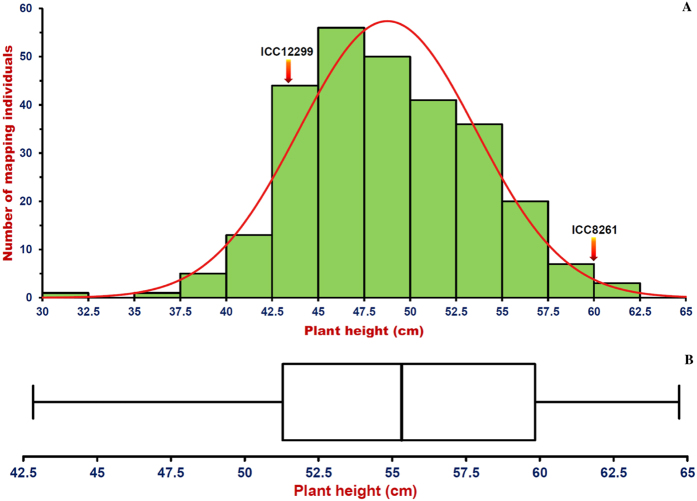
Figure 1.
(A) Frequency distribution of plant height (PH cm) trait variation estimated in a 275 mapping population (ICC 12299 x ICC 8261) illustrated a goodness of fit to the normal distribution. (B) Boxplots illustrating the variation of PH trait among 65 desi and kabuli chickpea accessions. Box edges denote the lower and upper quantiles with median values in the middle of the box.

