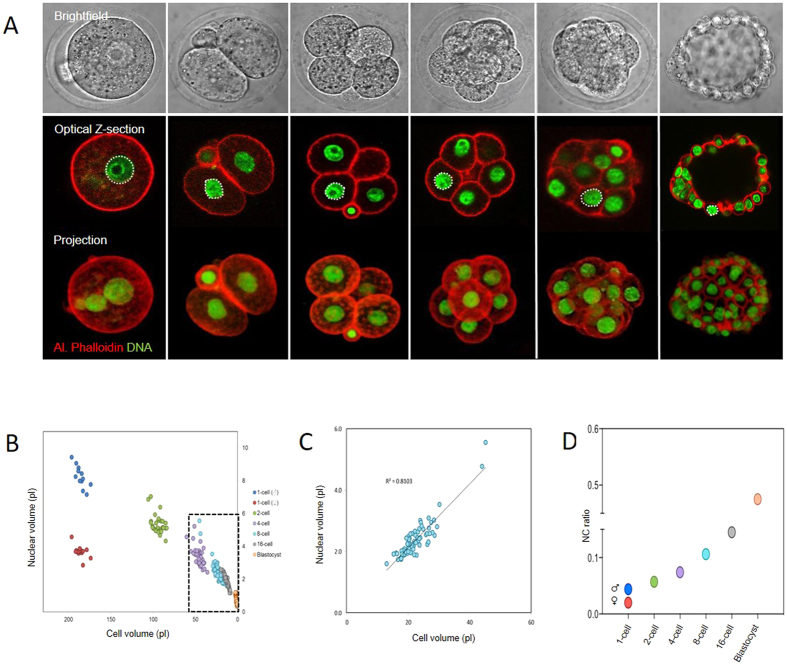
Figure 1. Nuclear volume and N/C ratio during early embryo development.
(A) Representative images of embryos used to measure volume. (B) Quantification of nucleus size, related to cell; size, on a cell by cell basis. Each data point represents an individual cell, colour codes reflect developmental stage. (C) ‘Zoomed’ representation of 8-cell embryo data. (D) Data expressed as mean nuclear/cytoplasmic ratio. Note that the N/C ratio progressively increases through preimplantation development. 12, 28, 48, 86, 88 and 82 nuclei analysed at 1,2,4,8-cell, morula and blastocyst stage respectively, over the course of 2 replicates.

