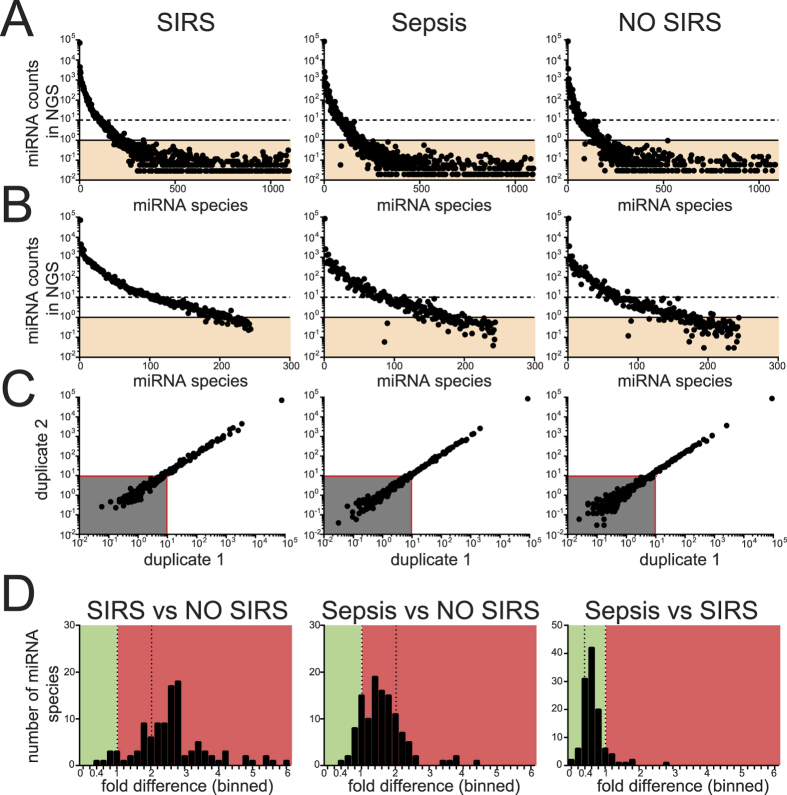
Figure 1. Patients plasma tested for miRNAs in Illumina NGS.
Plasma total RNA was extracted from 10 pools (representative of 89 ICU patients, as in Table 1) using the miRVana PARIS technology and then human miRNAs were sequenced using the Illumina next generation sequencing (NGS) platform. (A) Representative plots show the number of blood miRNAs (x-axis, sorted based on their abundance in the first duplicate of SIRS) and relative NGS counts (y-axis), in SIRS, sepsis and no-SIRS patients. Many miRNA were expressed below 1/105 NGS counts (orange shadowed areas) consistently across all pools and were excluded from further analysis. (B) Prolife of miRNA distribution after miRNAs with <1/105 counts (orange areas) in all pools were excluded. (C) miRNA counts in 2 identical replicates are shown in scatter plots for SIRS, sepsis and no-SIRS patients. Reproducible results were obtained for miRNAs with NGS counts >10/105 (red lines) and miRNA in the grey area were excluded. (D) The average miRNA counts (shortlisted in A–C, n = 116) from severe SIRS and Sepsis groups was expressed as a ratio against no-SIRS controls (left and middle panels) or in between each others (right panel), resulting in fold differences (fd) for each blood miRNA (histograms). Green and red areas, respectively, represent miRNA decrease and increase, separated by fd = 1 (left dotted line) and fd = +2 (right dotted line). Compared to no-SIRS, many CIR-miRNAs had fd > +2 in SIRS (left), but not in sepsis (fd < +2, middle). When Sepsis/SIRS are compared CIR-miRNAs are mostly downregulated (right).

