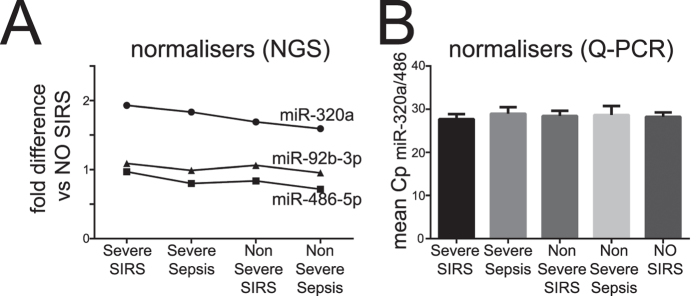
Figure 2. Shortlisting of internal normalizers in NGS and miRNA Q-PCR arrays.
Plasma total RNA extracted and analyzed in NGS as described in Fig. 1, in 10 duplicate plasma pools (5 groups representative of 89 individuals) (A) or in 89 individuals samples using the miRCURY LNA Universal RT microRNA PCR technology (B). (A) Among the finally shortlisted miRNAs (miR-320a, miR-92-3p and miR-486-5p), the fold-differences (fd) of average NGS counts seen in severe and non-severe sepsis and SIRS groups (8 pools representative of 73 individuals) relative to no-SIRS controls (2 duplicate pools, n = 16) are shown. (B) In miRNA qPCR arrays, normalizer miRNAs were tested for 89 individual patients in 5 groups: severe sepsis (n = 21); non-severe sepsis (n = 8); severe SIRS (n = 23); non-severe SIRS (n = 21); and patients without SIRS (no-SIRS controls, n = 16), in two independent technical repeat experiments. Because miR-92b-3p was below the level of detection in 22/89 patients, it was excluded from further analysis. The mean Cp of the miR-320a and miR-486-5p is shown in each group and was selected as an internal normalizer for the miRNA qPCR array dataset.

