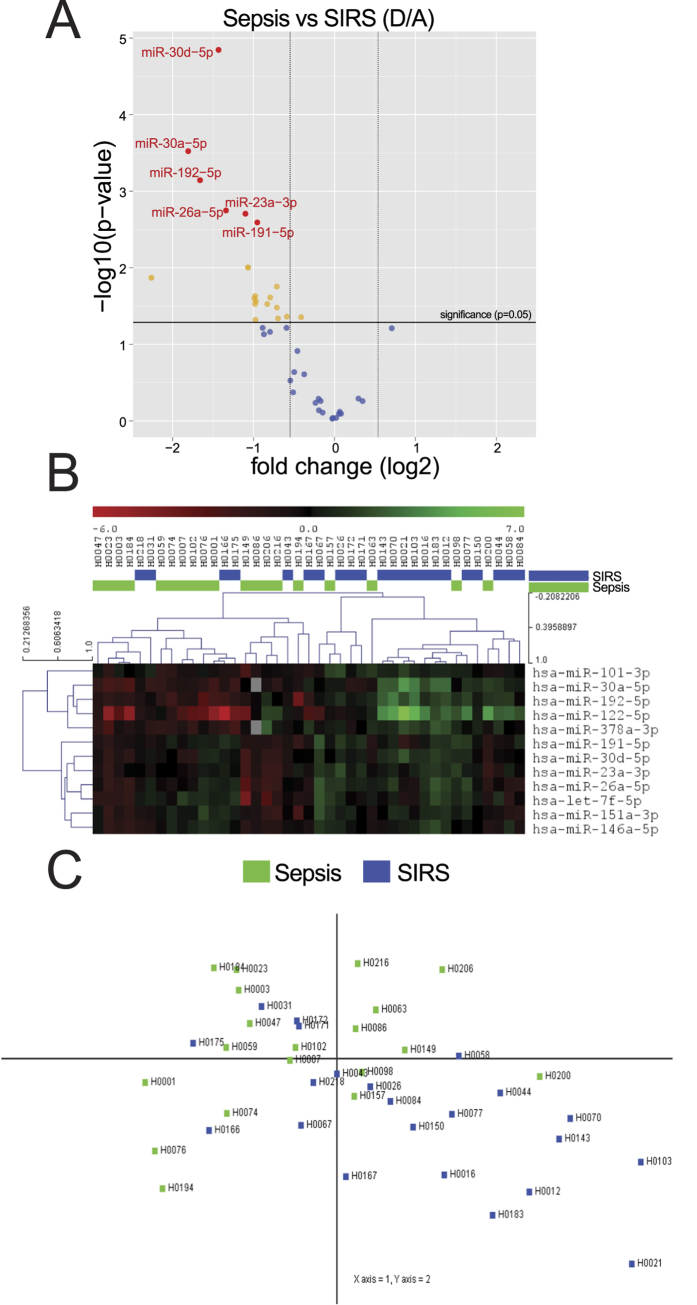
Figure 3. Shortlisted CIR-miRNAs measured with Exiqon miRNA qPCR arrays.
In miRNA qPCR arrays, within each patient’s specimen, Cp of a single miRNA is compared to the mean Cp of 2 normalizers (as from Fig. 2) to give delta-Cp (dCp). dCp of all patients are analyzed, comparing severe Sepsis (D, n = 21) and SIRS (A, n = 23). (A) Volcano plot shows fold changes (log2, D/A) relative to p values (−log10) in each miRNA assay. In the upper left quadrant of the plot, around 20 miRNAs are significantly (red and yellow dots above the horizontal black line, which indicates a level of significance p ≤ 0.05) downregulated in D/A (fd < −1.5, left vertical line), see Table 2. Orange and red dots represent significant differences by t-test (p < 0.05) with red dots representing miRNA that also passed the Benjamini-Hochberg correction. No CIR-miRNA significantly increased in D/A. (B) Heatmap shows the top 12 significant miRNA clustering with opposite patterns in D/A. (C) Principal component analysis (PCA) transforms the top 5 significant miRNAs to maximize the visualization of differences across the severe sepsis and SIRS groups. The PCA plot shows that within the dataset it is possible to discriminate patients with SIRS (blue dots, mostly in the lower right quadrant of the PCA plot) away from patients with sepsis (Fig. 3C, green dots falling in other quadrants).

