
Figure 4. CIR-miRNAs are good-to-excellent biomarkers of sepsis.
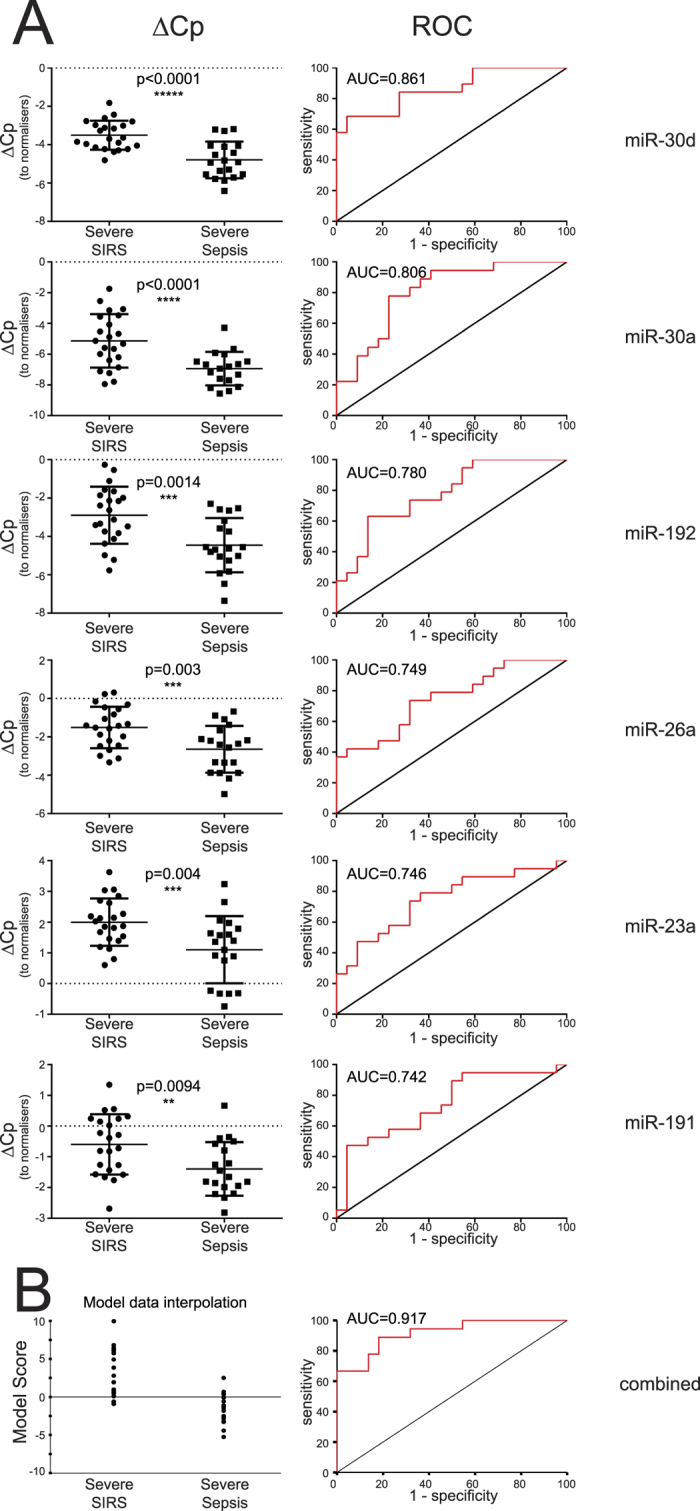
In miRNA qPCR arrays, data was analyzed as in Fig. 3 and the top-6 differentially expressed miRNA in sepsis compared to SIRS (after the Benjamini-Hochberg correction) are shown. (A) Left dot plots show dCp values in severe SIRS vs sepsis in individual samples (n = 21 and n = 23 for sepsis and SIRS respectively, except n = 20 in sepsis for miRNA-30a-5p) together with the level of significance. The relative receiver operator curve (ROC, right) is shown with the Area Under the Curve (AUC). Each of the top 6 significant CIR-miRNAs is a good-to-excellent biomarker and CIR-miRNAs were mostly downregulated in Sepsis compared to SIRS in Exiqon miRNA qPCR arrays. (B) A model combines the top-6 significant CIR-miRNAs to maximize distinction between SIRS and sepsis. The CIR-miRNA score is directly related to the odds of having SIRS or sepsis given the measurements of the 6 top miRNAs (see Material and Methods for further details). Left dot plot shows the model interpolation of the experimental cohort: SIRS patients -that have high CIR-miRNA levels (in A)- tend to score >0, whilst sepsis patients tend to score <0. ROC (and AUC, right) shows that the 6 CIR-miRNAs combined outperformed single miRNAs.