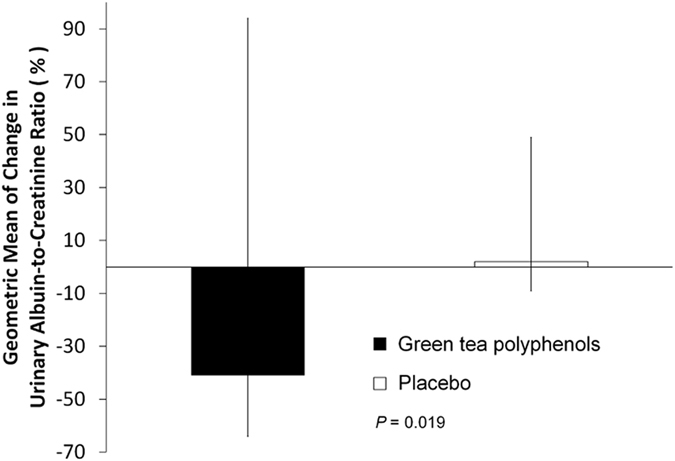
Figure 2. Patients in the green tea polyphenol group (n = 21) experienced a significant reduction in UACR, while patients in the placebo (n = 21) group experienced a small increase.

Geometric mean of % change in urinary albumin-creatinine ratio from baseline to the end of the study. Vertical bars represent the 95% confidence intervals. P value is for comparison between the green tea polyphenol and the placebo groups.
