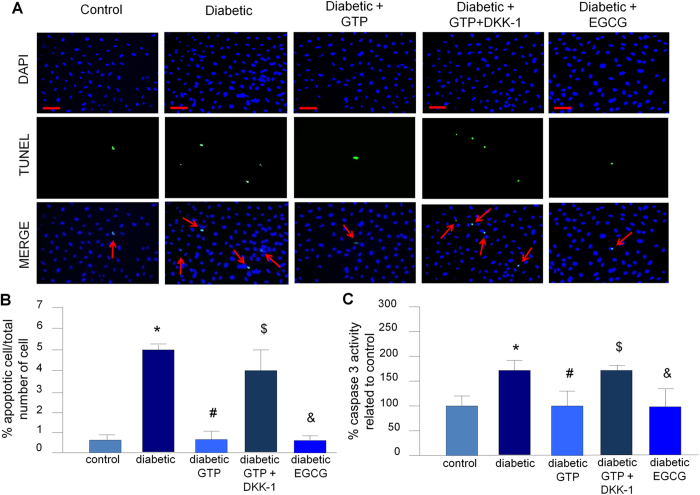
Figure 4. Analysis of podocyte apoptosis.
(A,B) TUNEL assay, scale bars 50 μm. Bars in B represent the median of three human plasma samples derived from an average of ten fields. Vertical bars represent the standard deviation. N = 3 for each condition. *P = 0.01 vs. control, #P = 0.01 vs. diabetic, $P < 0.001 vs. diabetic GTP, &P < 0.001 vs. diabetic. (C) Caspase-3 activity. Data are presented as mean ± SD; N = 3 for each condition. *P < 0.001 vs. control, #P < 0.001 vs. diabetic, $P < 0.001 vs. diabetic GTP, &P = 0.007 vs. diabetic. GTP, green tea polyphenol; DKK-1, dickkopf 1, EGCG, epigallocatechin gallate.

