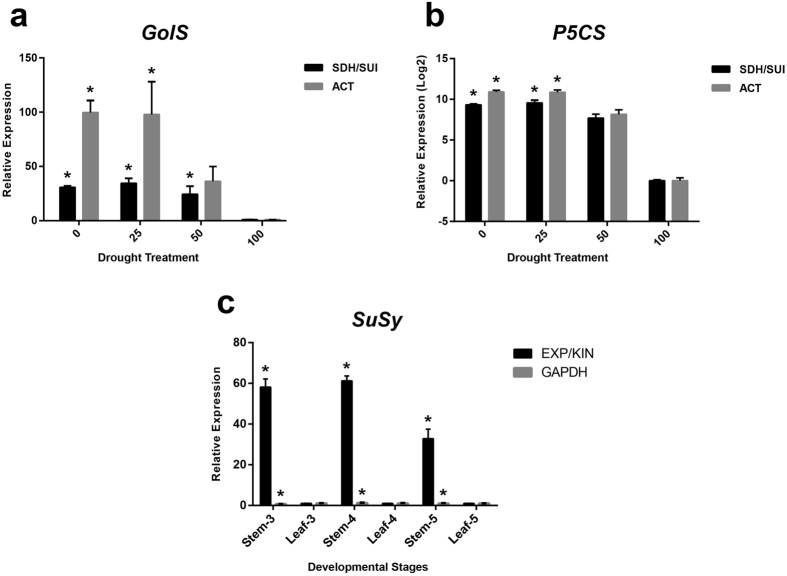
Figure 4. Relative expression level of target genes using the most and least stable pair of reference genes to each experimental condition, as determined by geNorm.
(a,b) Transcription levels of GolS and P5CS genes in Setaria viridis submitted to drought stress treatment (0 (Ψw-1.50 MPa; permanent wilting point), 25 (Ψw-1.125 MPa; severe stress), 50 (Ψw-0.75 MPa; moderate stress) and 100% (Ψw-0.03 MPa; field capacity), respectively; (c) Transcription levels of SuSy in tree developmental stages. Bars indicate the standard error (±SE) calculated from three biological replicates. The asterisks indicate statistically significant with respect to control (ANOVA followed by Tukey’s test).

