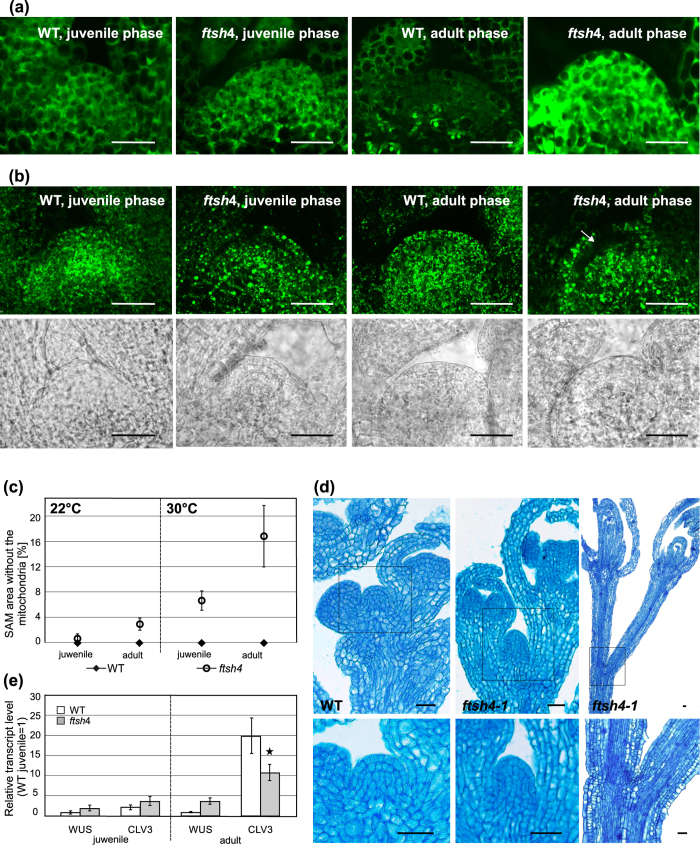
Figure 5. Meristem structure and stress response of ftsh4 mutants grown at 30 °C.
(a) The comparison of in vivo H2O2 accumulation in the meristems of juvenile and adult wild-type and ftsh4 mutants grown at 30 °C. Increased signal from the probe was detected only in adult ftsh4 mutant plants. Scale bars: 25 μm. (b) Distribution of mitochondria and their morphology in vivo in the meristems of juvenile and adult wild-type and ftsh4 transgenic lines grown at 30 °C. WT plants (WT;35S:Mt-GFP) are characterised by small mitochondria evenly distributed throughout the meristem, whereas in ftsh4 mutant plants (ftsh4;35S:Mt-GFP) mitochondria aggregate and some areas of the meristem completely lack GFP signal (denoted with arrow). The bright-light images of the corresponding meristems are presented below. Scale bars: 25 μm. (c) The average area (%) of the SAM with no GFP signal in the mitochondria in juvenile and adult wild-type and ftsh4 mutant plants grown at 22 °C and 30 °C. Only ftsh4 mutants have areas without GFP signal. Mean values ± SD from three experiments are shown. (d) The comparison of WT and ftsh4 mutant meristem structures at the generative stage prior to growth cessation. WT always had the same meristem structure prior to growth termination and the ftsh4 mutant plants showed 2 different types of growth cessation: normal dome-shape meristem, and no meristem. The upper panel presents the general overview of the meristems, and the lower panel represents their magnifications. Scale bars: 25 μm. (e) Expression levels of WUS and CLV3 in the shoot apices (SAM and youngest primordia) of the WT and ftsh4 plants, measured in juvenile and adult stages grown at 30 °C. Mean values ± SD from three experiments are shown. At both developmental stages the reference level was from the WT juvenile samples. Asterisks denote significant differences between WT and ftsh4 mutants in a given developmental stage.

