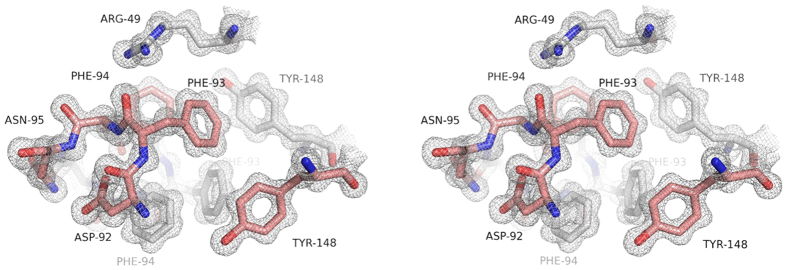
Figure 2. Stereo view of the 2mFo-DFc electron density map in the region of the subunit interface of apo-MytiLec.
Carbon atoms are shown in brown for one subunit and white for the other. Oxygen atoms are coloured red and nitrogen blue. Residues Phe 93 and Phe 94 from each subunit contribute significantly to the apolar interface. The map is contoured at 1 σ.

