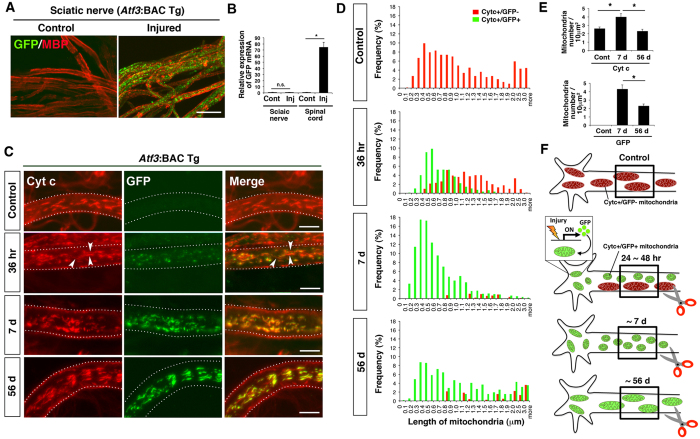
Figure 2. The length of axonal mitochondria was changed after sciatic nerve injury.
(A) Immunohistochemical staining for GFP and myelin basic protein (MBP) using teased sciatic nerve of Atf3:BAC Tg mice at 7 days after injury. (B) The expression of GFP mRNA in control and injured sides of sciatic nerves and spinal cord. Data are the mean ± SEM, compared with that of control side. (n = 3 independent experiments, n.s. not significant, *p < 0.001). (C) High magnification of a single sciatic nerve axon stained with cytochrome c (Cyt c) and GFP. The mitochondrial morphology changes over control, 36 hr, 7 d and 56 d after sciatic nerve injury. Arrowheads indicate GFP-negative and cytochrome c-positive mitochondria, which are considered to be pre-existing in the axon before injury. Dashed lines show the outline of a single axon. (D) Frequency distribution of axonal mitochondrial length after sciatic nerve injury. The red bars show GFP-negative and Cyt c-positive mitochondria, while the green bars show GFP-positive and Cyt c-positive mitochondria. Data was obtained from control (996 mitochondria in six mice), 36 hr (746 mitochondria in six mice), 7 d (1353 mitochondria in six mice) and 56 d (451 mitochondria in four mice) after sciatic nerve injury. (E) The number of Cyt c-stained and GFP-labelled mitochondria per 10 μm2 area in sciatic nerve was counted. Data represent means ± SEM. *p < 0.001, n = 4–6 mice. (F) A schematic illustration of axonal mitochondria before and after nerve injury. Red mitochondria indicate pre-existing mitochondria before nerve injury, while green mitochondria indicate newly labeled mitochondria in soma after nerve injury. The boxed area of the proximal axon is shown in Fig. 2C. 36 hr, 7 d and 56 d; 36 hours, 7 and 56 days after nerve injury respectively. Scale bars, 20 μm in (A) and 5 μm in (C).

