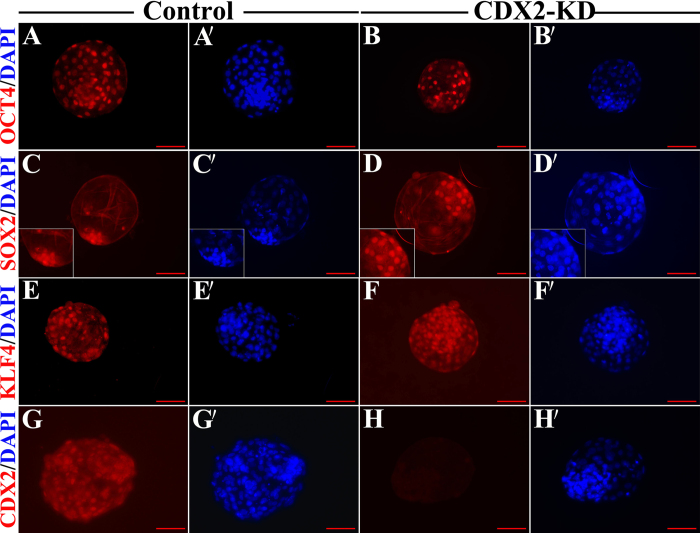
Figure 2. Expression and Localization of pluripotent associated factors in control and CDX2-KD blastocysts.
(A, A′ and B, B′) Immunofluorescent image of OCT4 at cell nucleus was fully positive in control and CDX2-KD blastocysts. (C, C′ and D, D′) Immunofluorescent image of SOX2 at cell nucleus was positive in ICM and negative in TE in control and CDX2-KD blastocysts. ICM staining was shown in inserted picture. (E, E′ and F, F′) Immunofluorescent image of KLF4 at cell nucleus was fully positive in control and CDX2-KD blastocysts. (G, G′ and H, H′) Immunofluorescent image of CDX2 at cell nucleus was fully positive in control blastocyst, and was full negative in CDX2-KD blastocyst. Bar = 100 μm.

