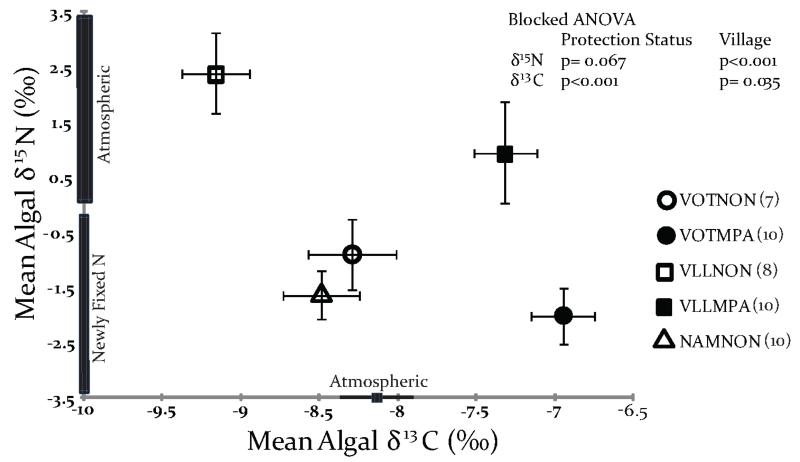
Figure 2.
Isotopic cross plot showing the relationship between algal δ15N and δ13C (mean± 1SE) by village and protection status. Villages are abbreviated as: Votua (VOT), Vatu-o-lailai (VLL) and Namada (NAM) with protected area (MPA) and fished area (NON) in each village. T. conoides was absent from Namada’s protected site (NAMMPA). N for each location is indicated in parentheses in the legend. Analysis by Blocked ANOVA found no significant difference in δ15N (p=0.067), while algae from the MPA were significantly enriched in 13C (p<0.001).

