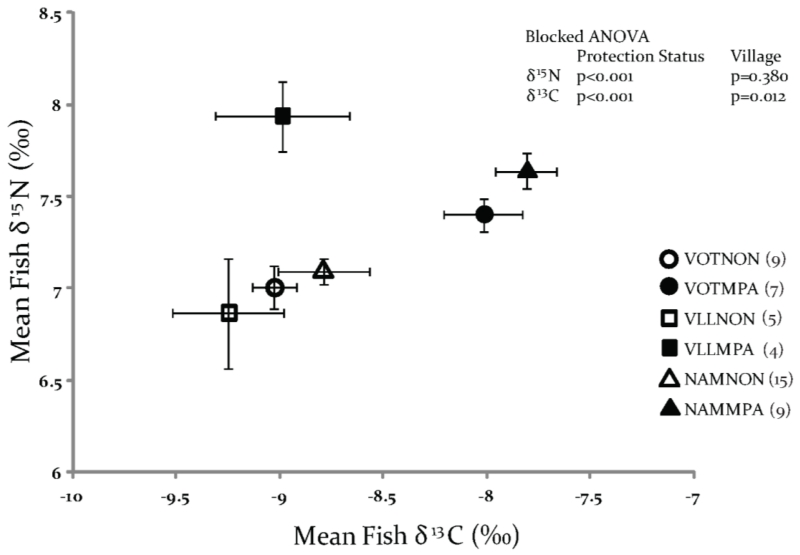
Figure 3.
Isotopic cross plot showing the relationship between fish δ15N and δ13C (mean± 1SE) by village and protection status.
Symbols, analyses and site abbreviations as in Figure 2; analysis by Blocked ANOVA found fish from the MPA were significantly enriched in 13C (p<0.001) and 15N (p<0.001).

