
Figure 2.
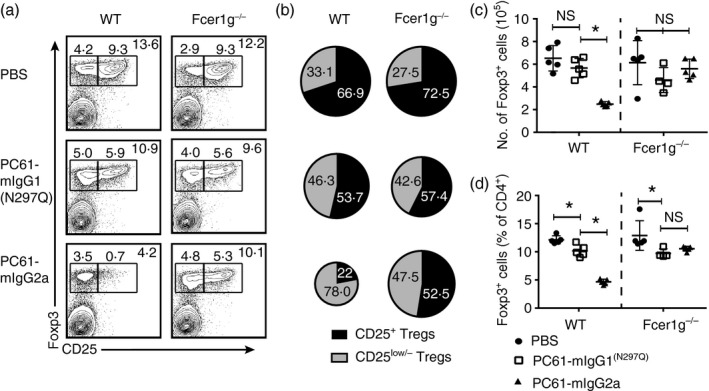
Fc‐engineered anti‐CD25 variants differentially impact regulatory T (Treg) cells in vivo. (a–d) B6 wild‐type and Fcer1g −/− mice were given a single dose of PC61‐mIgG1(N297Q), PC61‐mIgG2a or vehicle control and killed 7 days post‐injection for flow cytometric analysis of splenocytes. (a) Representative dot plots gated on Foxp3+ cells that are either CD25+ or CD25low/− within a CD3+ CD4+ gate. (B) Distribution of CD25+ Treg cells and CD25low/− Treg cells within the Foxp3+ population (mean). (C) Absolute number of Foxp3+ cells (mean ± SD). (D) Percentage of Foxp3+ cells within the CD3+ CD4+ gate (mean ± SD). Data are representative of three (a–d) independent experiments. *P < 0·05; ns, not significant.